


Automated financial and management reporting

Reporting-SmartBoard turns reporting from a manual, repetitive job into an automated and secure workflow. It saves time, improves accuracy and gets the right numbers to the right people.

Modern office building against a pale blue sky

Manual reporting steals time, causes errors and delays decisions

Most companies still build financial, operational and management reports in Excel, PowerPoint and email. Data is collected from several systems, checked by hand, copied into slides and sent to stakeholders. It is slow and error-prone.

Meanwhile management, boards, investors and regulators expect accurate numbers now, not once a quarter. It gets harder still when the same report must exist in several versions for different roles, without sharing confidential data with the wrong person.

What Reporting-SmartBoard does

Automated and intelligent reporting

SmartBoard connects directly to your data through RPA, APIs or databases, so reports are always up to date. One click produces a PDF, a PowerPoint or a live dashboard, with automatic updates, audit trail and version control.
Personalized reports at scale

Live dashboards and KPIs across finance, ESG and operations. SmartBoard creates and distributes a tailored report for each recipient, such as board members, branch directors or investors, while keeping data secure and GDPR compliant.

AI commentary on every chart

AI writes a short explanation and flags deviations for each chart, so readers see why a number moved, not just that it did.

Up to 80%
less manual reporting time
1 click
to PDF, PowerPoint or dashboard
Real time
numbers for CFOs, controllers and management

Dashboards

Dashboards you build and change yourself

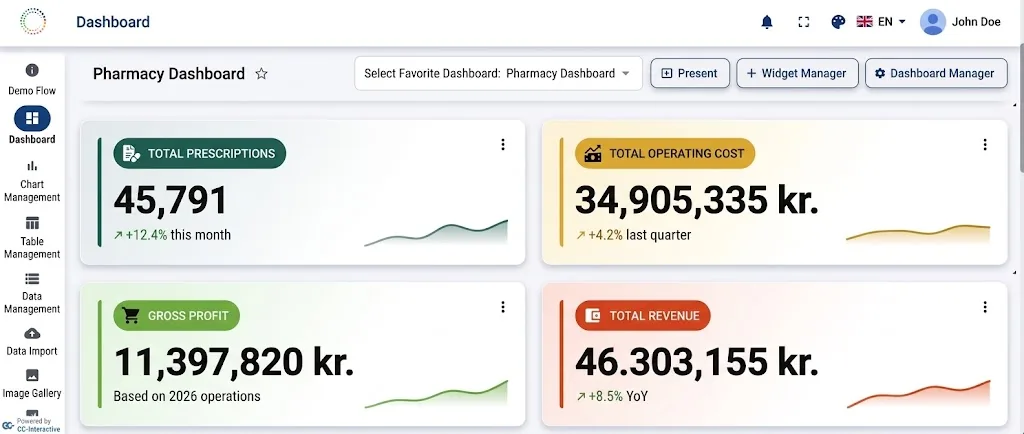
Combine charts, tables and KPIs into dashboards for production, finance, sales or ESG. Save favourites, move widgets around and put the dashboard on a big screen with one click.

  • Widget Manager and Dashboard Manager, no code
  • Favourite dashboards per user
  • Present mode for meetings and wall screens
  • Light and dark view, and several languages
SmartBoard KPI tiles for revenue, costs and gross profit

Frequently asked questions

Which reports can Reporting-SmartBoard automate?

Financial, management, board, investor and operational reports, plus KPI dashboards for branches and departments. Reports come out as PDF, PowerPoint or live dashboards.

Can different people get different versions of the same report?

Yes. SmartBoard creates and sends a tailored version to each recipient, and only includes the data each person may see.

How much time does it save?

Customers typically cut manual reporting time by up to 80%, because data collection, validation and formatting are automated.

Stop building reports by hand

Book a 30-minute demo. We look at your current reporting and show where robots and AI can take over, often starting with a small pilot that pays for itself.